



Discover and collection pages
Every collection on mints opens in the same terminal: the list on the left, the collection with its chart in the middle, the cheapest listings on the right. Discover is the full table when you want to compare.
The collection terminal
The home page opens a collection right away, and so does every link to /c/chain/collection. On a wide screen it fits in one window: the left and right columns stay in place while the middle scrolls.
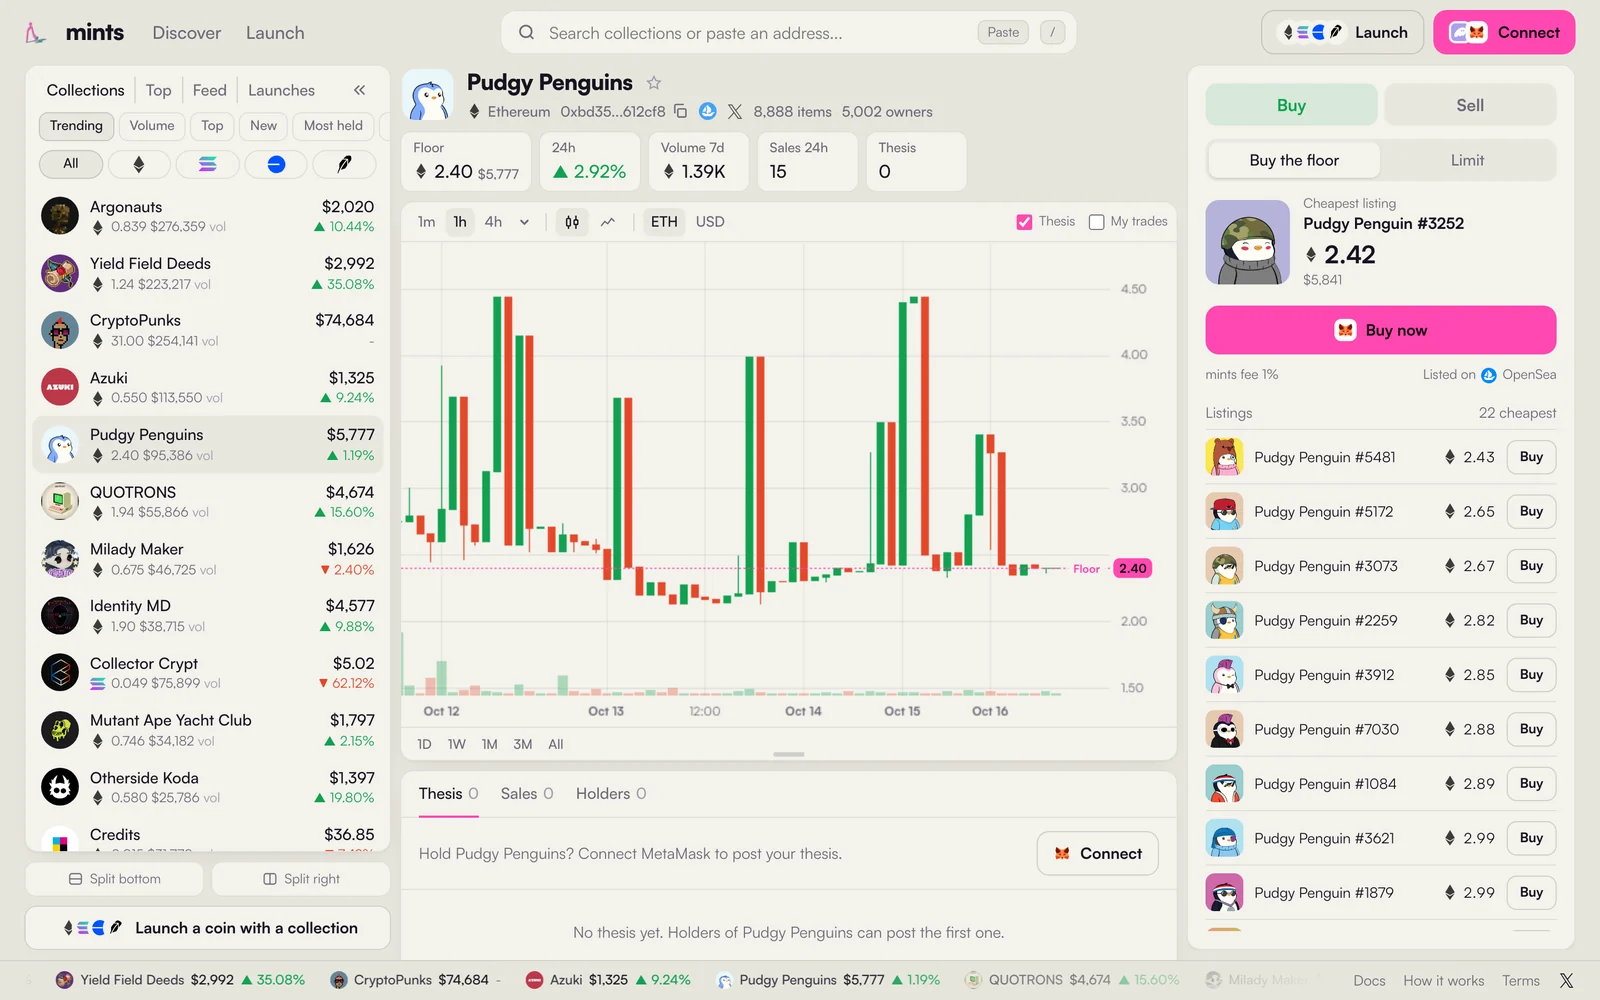
- 1Search by name, or paste a contract or collection address.
- 2Left column Collections, Top, Feed and Launches, each with its own filters.
- 3The collection the star after the name adds it to your watchlist. Under it: the chain, the contract address (click to open the explorer, or copy it), OpenSea, X or Magic Eden links, items and owners.
- 4Numbers floor with its dollar value, change in 24 hours, volume over 7 days, sales in 24 hours and the thesis count.
- 5Floor chart built from every sale on the market, with thesis avatars and your own trades on mints.
- 6Thesis, Sales, Holders what holders say, trades made on mints, who holds through mints.
- 7Buy the floor the cheapest listing and the next ones, each one click away.
- 8Top collections running along the bottom with live floor prices.
- 9Launch start a coin with its own collection.
- 10Connect sign in with Phantom or MetaMask.
The left column
Four tabs share the left column. When the column is narrow the labels shorten: Leaderboard reads Top, and on an even narrower column Collections reads NFTs.
| Tab | What it lists |
|---|---|
| Collections | Every collection we track, in one of the lists below, filtered by chain. |
| Top | Traders ranked by what they traded on mints. See Leaderboard and Feed. |
| Feed | Every trade made on mints and every new thesis, as they happen. |
| Launches | Coins launched on mints, each with its own collection. See Launch a coin with a collection. |
The lists of the Collections tab
| List | How it is sorted |
|---|---|
| Trending | Dollar volume of the last 24 hours, pushed up or down by how fast the floor moved. A collection whose floor rose 20% ranks as if it traded 20% more. |
| Volume | Dollar volume of the last 24 hours. |
| Top | Volume of the last 7 days, in dollars so all four chains compare. |
| New | The date the collection was created. |
| Most held | Number of owners. |
| Gainers | Floor change over 24 hours. |
| Watchlist | Collections you starred. Stored in this browser. |
Under the lists, Split bottom and Split right open two panels at once, for example Trending and Feed. The layout is remembered on this device. The arrows at the top fold the column into a thin strip when you want more room.
Thesis, Sales and Holders
The tabs under the chart show what happens on mints, like FOMO does: trades made through mints and the people who hold through mints. The chart and the numbers above it stay market wide. What counts as a trade on mints is listed in Leaderboard and Feed.
- Thesis lists what holders wrote, newest first, with their size and PnL. Click one to open that holder's position. More in Thesis.
- Sales lists trades made on mints in this collection: item, price in the chain's currency and in dollars, the trader with a Buy, Sell, Mint or Drop label, time and a link to the transaction. Before the first one it reads: No trades on mints yet. Buy the floor to be the first.
- Holders lists wallets that hold through mints: what they got on mints minus what they sold on mints. Their average entry is the average they paid on mints; drops are free and do not count in it. Next to it: the position at today's floor, PnL and the latest thesis.
 2.40$5,762Buymira12s ago2.52$6,050Sell0x8f3c...41d03m ago2.31$5,546Buyilsa11m ago2.29$5,498Buytomo26m ago
- 1Columns item, price, trader, time and transaction.
- 2A trade on mints the item and its price in the chain's currency and in dollars.
- 3Trader Buy, Sell, Mint or Drop, then the name. Click the row to open that wallet's position.
7.20$17,290+1.11 ETH▲ 18.23%2.03Bought the dip under 2.1.4.80$11,527+0.18 ETH▲ 3.90%2.31Floor keeps getting swept, holding.2.40$5,763-0.12 ETH▼ 4.76%2.52-- 1Columns holder, position at the floor, PnL, average entry and latest thesis.
- 2A holder through mints with how many they hold through mints.
- 3PnL and entry today's floor against the average they paid on mints.
Discover
Discover is one quiet table of every collection we track, at /discover. It shows the top 30 collections of each chain by volume over the last 7 days, plus everything launched on mints. Its filters are the lists of the Collections tab plus Launched: collections started on the mints launchpad.
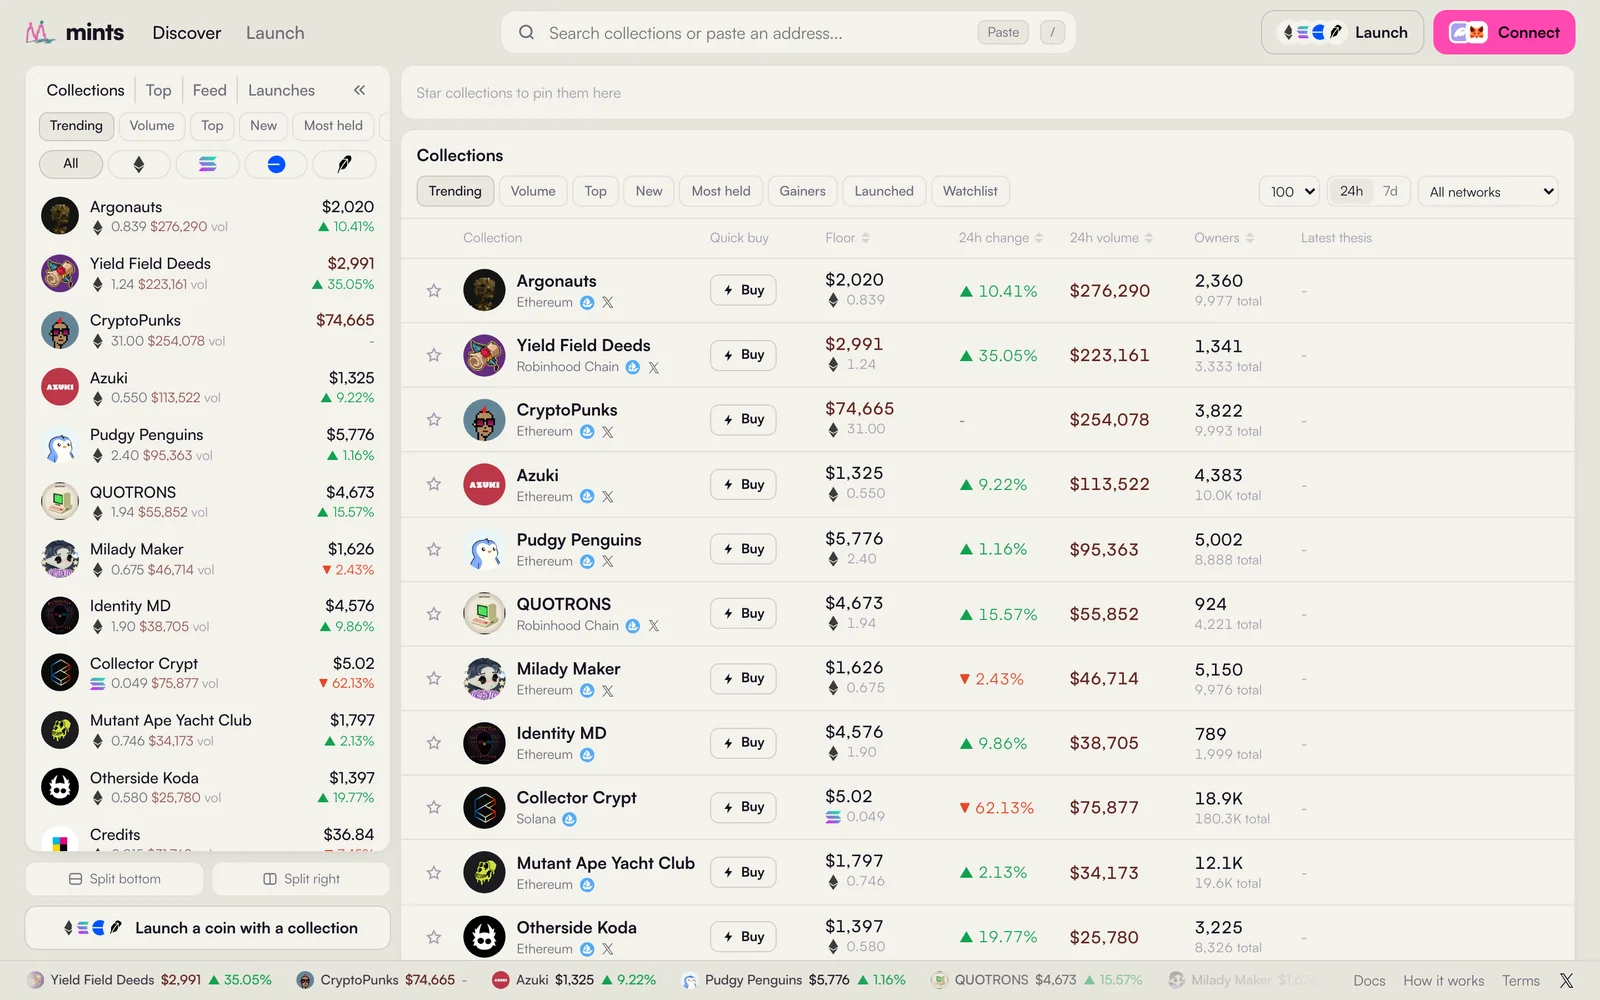
- 1Pinned star a collection anywhere and it is pinned in this strip.
- 2Rows show 25, 50 or 100 collections.
- 3Network all networks or one.
- 4Sort click any column title to sort by it, click again to flip the order.
- 5Quick buy buys the cheapest listing of that row without leaving the table.
- 6Latest thesis the newest note from a holder of that collection.
- 7Left column the same tabs as on a collection page, and it folds away.
Where the data comes from
Collections, market sales and listings on all four chains come from  OpenSea, refreshed every 10 minutes, with new listings and sales streamed in between. Market sales draw the chart and feed the numbers above it. Trades made on mints come from our own ledger, and collections launched on mints from our own records and the chain itself. Dollar values use live ETH and SOL prices and update every second.
Prices on the chart and in the stats are in the currency of the chain: ETH on Ethereum, Base and Robinhood Chain, SOL on Solana. Sales paid in stablecoins are converted at the current rate; sales in other tokens are left out so they cannot distort the floor.