


The floor chart
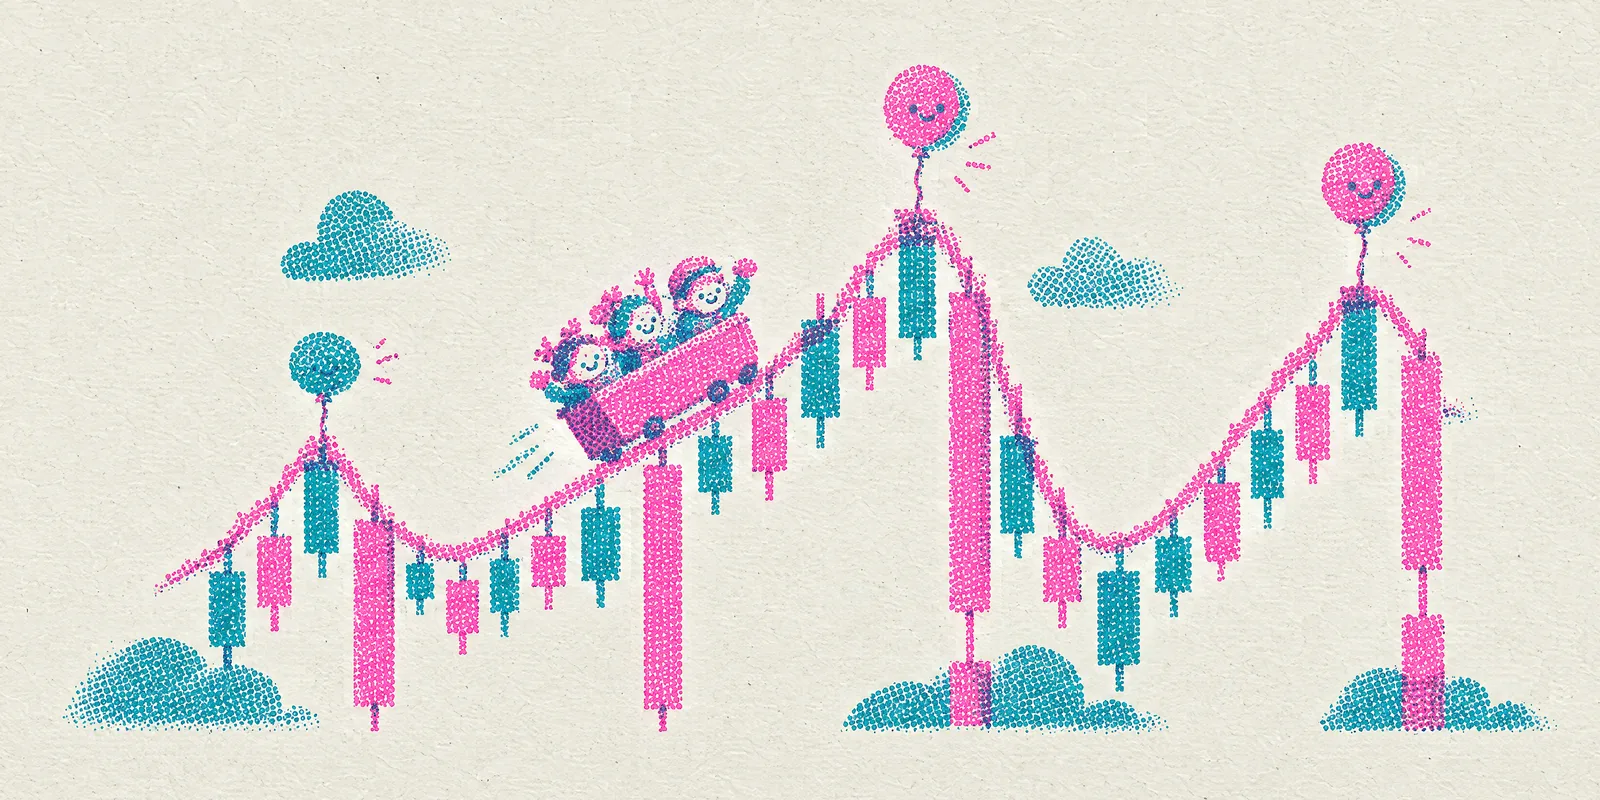
Every collection has a price chart built from its real sales on the whole market, with the people who hold it sitting right on the line. You can drag it, zoom it, stretch it and click anyone on it.
What the chart shows
The chart is drawn from every sale of the collection on the market, wherever it happened, so the price is the real one. Each candle covers one interval of time. It opens at the price of the sale before it, its high and low are the highest and lowest sales inside it, and it closes at the last one. Intervals without a sale stay empty so time runs evenly. The bars at the bottom are the number of sales.
The dashed line is the current floor: the cheapest listing right now. Very cheap or very expensive one off sales, far from the sales around them, are left out so a single grail or a mistake does not flatten the chart.
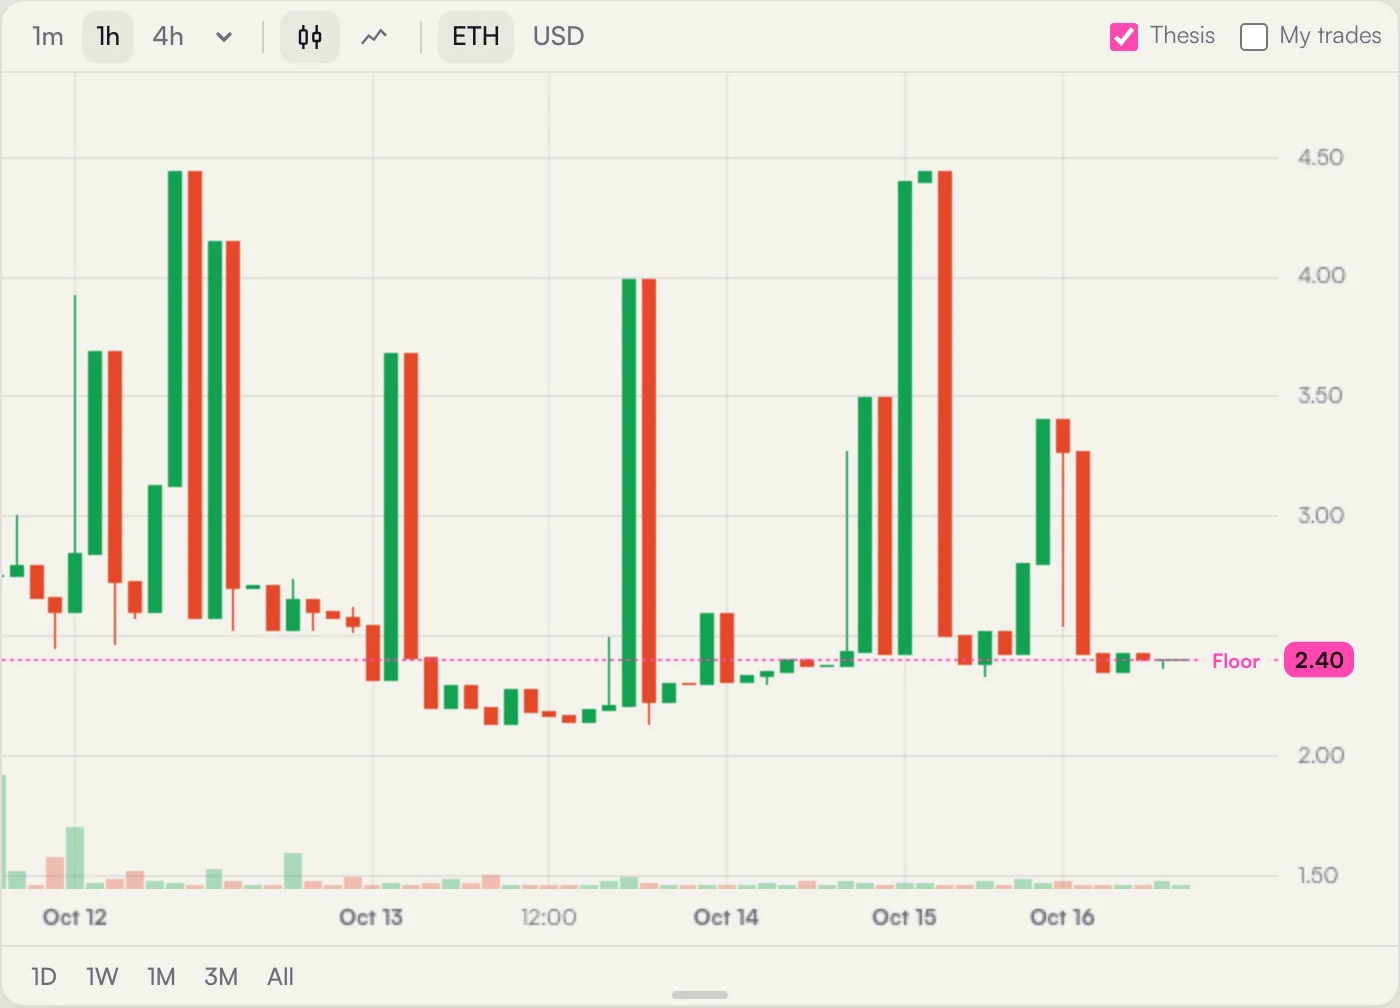
- 1Interval how much time one candle covers. 1m, 1h and 4h are one click away.
- 2More intervals the full list from 1 minute to 1 week. Your choice is remembered on this device.
- 3Candles or line two ways to draw the same sales.
- 4ETH or USD prices in the chain's currency or in dollars at the live rate.
- 5Thesis show or hide holder avatars on the chart.
- 6My trades show your own trades on mints as B and S marks.
- 7Floor the cheapest listing now, as a dashed line and a label.
- 8Range jump to the last day, week, month, three months or all of it. The candle size stays.
- 9Handle drag to make the chart taller or shorter.
Moving around
The chart follows your hand: it moves with the pointer, keeps gliding a little when you let go, and never jumps. Live updates add new sales without changing where you are looking.
Moves the chart in time. Let go while moving and it glides to a stop.
Zooms in time around the pointer. A horizontal swipe moves the chart instead.
Zooms in time on a trackpad or a phone.
Stretches or squeezes the price scale around the pointer. Auto scale turns off.
Turns auto scale back on, so the price axis fits the visible candles again.
Makes the chart taller or shorter, from 240 px up to most of the screen. Double click it to reset. The height is remembered on this device.
| To do this | Mouse | Trackpad or touch |
|---|---|---|
| Move in time | Drag, or wheel with Shift | Swipe left or right, or drag |
| Zoom in time | Wheel | Swipe up or down, or pinch |
| Stretch prices | Wheel over the price axis, or Alt plus wheel | Swipe over the price axis, or hold Alt |
| Fit prices again | Double click the price axis | Double tap the price axis |
| Reset the view | Double click the chart | Double tap the chart |
People on the chart
Two kinds of marks sit on the candles. They stack outward so they never cover each other: sells above the high, buys below the low, thesis avatars above the sells. When marks of neighbouring candles would touch, the less important ones hide until you zoom in.
- 1Thesis avatar a holder posted a thesis in this candle. Hover it to read the thesis, click it to open their position.
- 2B a buy made on mints. With My trades on, these are your own.
- 3S a sale made on mints.
- 4Floor the cheapest listing right now.
The position window
Click an avatar on the chart, a row in Holders, a sale in Sales or a thesis, and that wallet's position opens on top of the page. It shows the same chart with only their trades and thesis, their thesis history, and their numbers.
 Explorer2.402.9% 24h
Bought the dip under 2.1. Holding through the next drop.
Second one. The floor keeps getting swept.
7.202.102d2.604d1.989d2.0112d- 1Who name, address, a link to their profile and to the explorer.
- 2Their chart the collection's chart with this wallet's trades on mints and its thesis.
- 3Thesis history every thesis they posted here, the latest first.
- 4Position what they hold at today's floor, PnL, average entry and how much they put in.
- 5Transactions their trades made on mints, each linked to the chain.
Held is what the wallet holds right now. PnL here is unrealized: what those NFTs are worth at the current floor, minus their average entry. Entry and Invested come from the wallet's buys on mints, mints included; drops are free and do not count, and purchases made elsewhere do not show. The leaderboard uses realized PnL instead, see Leaderboard and Feed.